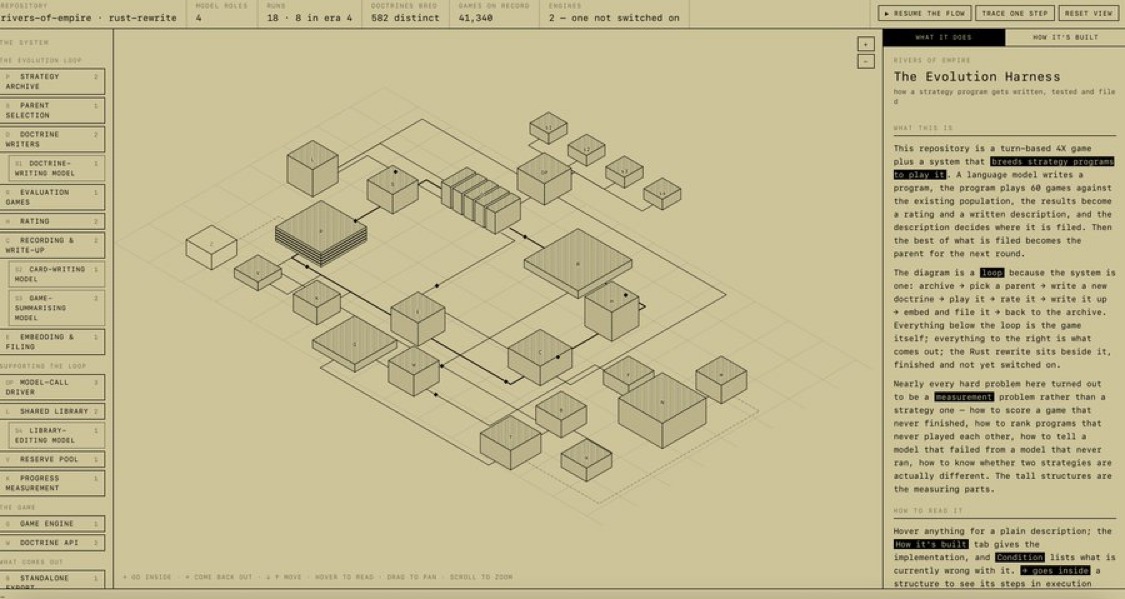
This was a tweet I saw somewhere (sorry I do not have the link anymore) but I managed to snag a screenshot. I got Claude to convert this into a skill that works pretty well. Try it out below.
---
name: codebase-diagram
description: Turn a codebase, system, or process into a single-file interactive isometric diagram (HTML) for discussing architecture with Claude. Use when the user asks to "diagram this repo", "visualize this codebase", "draw this system", or wants an explorable map with inspectable data flows. Output is one self-contained HTML file in the drafting-paper style: tan background, ink-lined isometric blocks, moving dots that carry real payloads, left component nav, right explanation panel.
---

# Codebase Diagram Skill

Render a system as an interactive isometric map so the human and Claude can point at the same picture while discussing it. One HTML file, no dependencies except a Google Fonts link for IBM Plex Mono.

## When to use

- The user wants to understand or discuss a repo's architecture.
- The user wants to explain a process (an agent loop, a pipeline, a forward pass) to someone else.
- The user says "diagram", "map", "visualize the codebase", or references a previous diagram in this style.

## Step 1: Read the system first

Never diagram from the file tree alone. Before drawing:

1. Read entry points, main loop, and config. Identify 6 to 14 components. Fewer than 6 means the diagram is trivial; more than 14 means group things.
2. Identify the edges: who calls whom, what data moves on each edge, which direction.
3. Identify 6 to 10 real payloads: concrete pieces of data in transit (a prompt, a tool call JSON, a row, a vector, a result). These become the moving dots. Use real values from the codebase or a plausible traced run, never lorem ipsum.
4. Decide the one risk or cost block (highest latency, highest danger, most parameters). It gets the hatched texture or the tall stacked plates.

## Step 2: Assign the visual encoding

Three independent channels. Assign each one deliberately, then declare all three in an on-canvas legend (top-left, bordered box). A viewer must be able to decode the diagram from the legend alone.

**Channel 1 — Color = kind of thing.** Categorize every component into at most 4 types. Default taxonomy for software systems:

| Type | Top face | Side face | Meaning |
|---|---|---|---|
| ORCHESTRATION | #E4DAAE | #B7AB7C | Plumbing. Moves data, makes no decisions. |
| MODEL / COMPUTE | #D98A5F | #A85A33 | The part that decides or computes. |
| TOOL / ACTION | #8FA3B0 | #5F7684 | Acts on the real world. |
| SUBSTRATE | #C9C2A6 | #9E9678 | Acted upon, never acts (filesystem, DB, ground). |

Rename types to fit the subject (a data pipeline might use SOURCE / TRANSFORM / SINK / STORE) but keep the count at 4 or fewer and keep colors muted enough to sit inside the paper palette. Show a color swatch next to each entry in the left nav.

**Channel 2 — Height = the dominant cost.** Pick one measurable quantity (wall time share, dollar cost, parameter count) and map it to block height. The costliest block should visibly tower; plumbing should be squat (h 14 to 20). Stacked plates remain an intensifier for the single dominant block.

**Channel 3 — Footprint (w × d) = data volume.** The block that the most data flows through gets the widest base, even if it is fast and flat. Substrates get large footprint and near-zero height (h 6 to 10): they hold everything and do nothing.

**Overlays, unchanged:**

| Visual | Meaning |
|---|---|
| Hatched side texture | Permission-gated or highest-risk (arbitrary execution, writes, money) |
| Solid edge | Forward data path |
| Dashed edge | Returns, results, loops back |

**Bending the encoding.** Occasionally a block deserves emphasis its metric does not justify (an Edit tool that takes 0.1s but rewrites your code). Bending height for stakes is allowed at most once per diagram, and the block's panel copy must admit the bend explicitly. Hatching is the honest signal for risk; height bends are emphasis only.

Each block's panel gets a one-line stat strip under the title showing its type, its cost-channel value, and its data-channel value (e.g. "TOOL · PERMISSION-GATED · 2 calls · 4.1s"), so the encoding is verifiable per block.

## Step 3: Build from the template

Use the fixed design system. Do not restyle.

Palette (base plus the four type colors from Step 2):
```
--paper:#D6CB9E  --paper2:#CFC391  --ink:#23231E  --line:#3A3A30
--hatch:#8F8560  --hltxt:#E9E2C4   --accent:#B4451F
--panel:#DDD3A8  --dim:#6E6852
--c-orch:#E4DAAE/#B7AB7C  --c-model:#D98A5F/#A85A33
--c-tool:#8FA3B0/#5F7684  --c-sub:#C9C2A6/#9E9678
```
The accent (#B4451F) stays reserved for selection outlines and the moving dots. Never use it as a block color.

Type: IBM Plex Mono everywhere. Labels 8.6px, ids 7.5px, panel body 11.5px. All-caps for labels and section headers, letter-spacing 0.1em to 0.16em.

Layout: top stats bar (4 to 6 cells of real numbers about the system, plus PAUSE / TRACE ONE STEP / RESET buttons), left nav (~200px, grouped component tabs), center SVG stage with a faint grid, right panel (~340 to 360px) with two tabs.

Isometric projection, use exactly this:
```js
function iso(x,y){return [x - y*0.62,(x + y*0.62)*0.5];}
function pt(x,y,z){const [ix,iy]=iso(x,y);return [ix+OFFSET_X, iy-z+OFFSET_Y];}
```
Each block is three polygons: right side, front side, top. Draw blocks sorted by (x+y) ascending so overlap is correct. Stacked plates are extra inset top polygons at increasing z.

Dots: each payload gets a route (an array of edge keys), animates along the concatenated path lengths via `getTotalLength`/`getPointAtLength` in one `requestAnimationFrame` loop. Clicking a dot freezes it and shows its payload in the right panel inside a `<pre>`. Hide dots under `prefers-reduced-motion`.

Interactions, all required: click block to select and read, two content tabs per block (WHAT IT DOES plus one more; pick the second axis to fit the subject: HOW IT'S BUILT, HOW IT MOVES, WHY IT WORKS), drag to pan, scroll to zoom, RESET restores viewBox and unfreezes dots, keyboard focus and Enter-to-select on blocks.

## Step 4: Write the panel copy

Each block gets `short` (one line), plus one paragraph per tab. Rules:

- Write what the block actually does in this system, with real names and real numbers from the code.
- The second tab carries the insight: tradeoffs, why it is shaped this way, what breaks.
- The hint line at the bottom of the stage and the "THE MOVING DOTS" section in the panel explain the interaction model.
- Follow the user's writing rules if they have any (for this user: the vibelogs AI slop rules apply to all copy).

## Step 5: Verify

- Open the file or render it headless if possible. Check labels do not overlap; move blocks on the x/y plane, not the font size, to fix collisions.
- Every edge key referenced by a dot route must exist in the edges map, or the animation loop throws.
- Decode-check the legend: cover the panel text and confirm the tallest block really is the costliest, the widest really carries the most data, and every hatched block really is gated. If any channel lies (beyond the one admitted bend), fix the geometry, not the legend.
- Confirm exactly one file, no external JS.

## Reference implementations

Three complete examples built with this skill:
- `claude-code-diagram-v2.html` — the primary template: agent loop with the full three-channel encoding, legend, swatched nav, and per-block stat strips. Copy this one.
- `claude-code-diagram.html` — v1, pre-encoding. Kept for comparison only.
- `llm-first-principles.html` — a transformer forward pass; shows how the same scaffolding fits a conceptual (non-repo) subject. Predates the encoding system; if rebuilding it, apply Step 2.

Copy the nearest one and replace NODES, EDGES, PAYLOADS, SECTIONS, the legend contents, and the stats bar. The interaction scaffolding (pan, zoom, dot engine, panel renderer) should not need edits.

Copy the nearest one and replace NODES, EDGES, PAYLOADS, SECTIONS, and the stats bar. The interaction scaffolding (pan, zoom, dot engine, panel renderer) should not need edits.